Lognitor: Logs, Errors, Monitoring, and AI — In One Tool
Most teams juggle 3-4 separate observability tools. Lognitor puts log management, error tracking, uptime monitoring, alerts, and AI-powered analysis into a single dashboard. Every error is auto-triaged by AI before anyone looks at it. Free tier available — no credit card required.
If you're running a production app, your observability stack probably looks something like this: one tool for error tracking, another for logs, a third for uptime monitoring, and maybe a fourth for alerting. Each with its own dashboard, its own billing, and its own learning curve.
When something breaks at 3am, you're not debugging — you're tab-switching. Open the error tracker, see the stack trace, need log context, switch to the log tool, need to know if the endpoint is down, switch to the uptime monitor. By the time you've correlated the data across three dashboards, ten minutes are gone.
Lognitor was built to fix this.
One Platform, Not Four
Lognitor is an observability platform that combines log management, error tracking, uptime monitoring, alerting, and AI-powered analysis into a single dashboard.
When an error fires, the surrounding log context is right next to it — no switching tools. When your uptime monitor detects a problem, the related errors and logs are visible in the same view. Everything is correlated by default because everything lives in one place.
Here's what's included:
Log Management — Real-time log tailing, structured search with metadata filters, saved queries, and contextual annotations. Logs are first-class citizens, not an afterthought.
Error Tracking — Automatic fingerprint-based grouping, full stack traces, affected user counts, occurrence trends, and release-level error diffing. See which errors are new, which are recurring, and which are getting worse.
AI Analysis — This is where Lognitor gets interesting. Every new error is automatically classified by severity with a probable root cause — before anyone looks at it. You can ask your logs questions in natural language: "Why did checkout fail between 2 and 3am?" and get answers with log references. AI reconstructs incident timelines across services, showing what happened in what order. And you can create alert rules by describing them in plain English.
Uptime & Heartbeat Monitoring — HTTP endpoint checks with response time tracking and heartbeat monitors for background jobs and cron tasks.
Alerting — Rule-based alerts with email and webhook notifications. On AI-enabled plans, describe alert conditions naturally: "Notify me if error rate exceeds 5% in any 10-minute window."
AI That's Included, Not Bolted On
Most observability tools treat AI as a premium add-on charged per developer per month. The bigger your team, the higher the AI bill — on top of what you're already paying for the base platform.
Lognitor includes AI capabilities in the plan itself. Auto-triage, natural language log queries, incident timelines, and AI-suggested alerts are available to the whole team. No per-seat AI charges.
For teams that need more AI power beyond what's included, an AI wallet lets you purchase additional credits on demand from any plan — including the free tier.
Setup in 2 Minutes (Not an Exaggeration)
SDKs are available for Node.js, Python, PHP, React, and Browser. Here's the complete setup for a Node.js app:
npm install @lognitor/node
import Lognitor from "@lognitor/node";

Lognitor.init({
  apiKey: process.env.LOGNITOR_API_KEY,
  service: "my-api",
  environment: "production",
});

// Structured logging with metadata
Lognitor.info("Order placed", {
  metadata: { userId: "usr_123", orderId: "ord_456", amount: 49.99 },
});

// Errors are auto-captured — uncaught exceptions and
// unhandled rejections are sent with full stack traces
That's it. Errors auto-captured. Logs flowing. AI analyzing. No agents to install, no YAML to configure, no infrastructure to maintain.
For Python, the setup is equally straightforward:
pip install lognitor
import lognitor

lognitor.init(
    api_key=os.environ["LOGNITOR_API_KEY"],
    service="my-api",
    environment="production"
)

lognitor.info("Server started", metadata={"port": 8000})
Framework integrations for Express, Django, Flask, FastAPI, Laravel, and Symfony handle request logging and error capture automatically with a single middleware line.
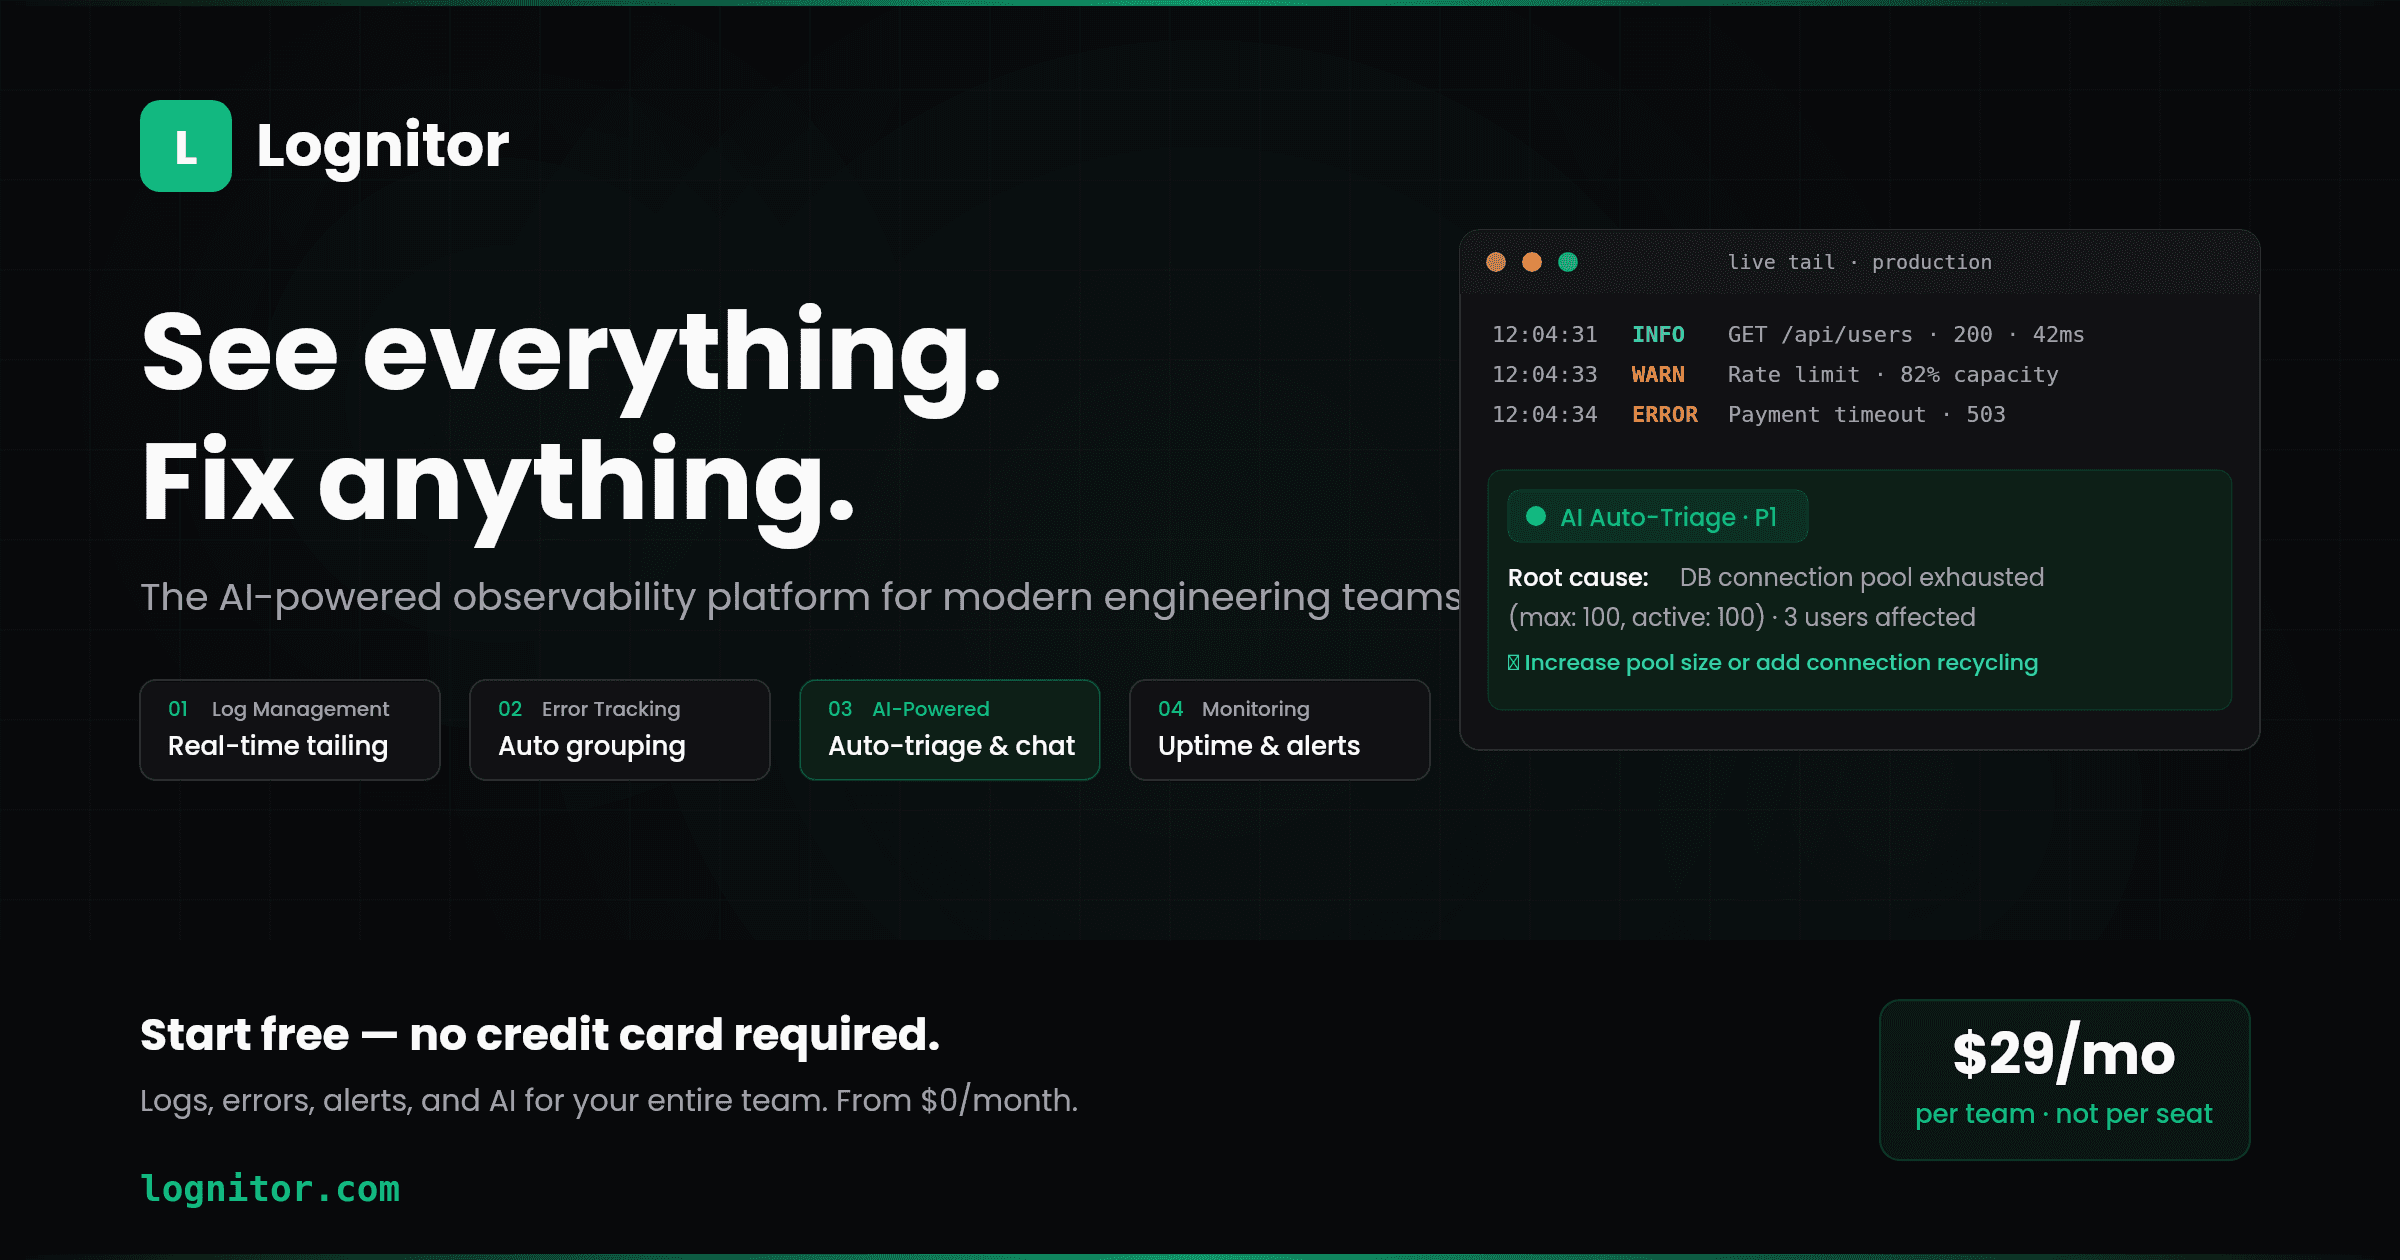
What AI Auto-Triage Actually Looks Like
Here's a real example of what happens when an error occurs in Lognitor:
- A
PaymentService.processCharge()call throws a timeout error - Lognitor captures the error with the full stack trace and surrounding log context
- AI auto-triage kicks in immediately:
- Severity: P1 — Critical
- Root cause: Database connection pool exhausted (max: 100, active: 100)
- Affected users: 3
- Related events: Connection pool warnings started 12 minutes before the error
- Suggestion: Increase pool size or add connection recycling
All of this is generated before anyone on the team opens the dashboard. The on-call engineer starts with context, not a cold stack trace.
Natural Language Log Search
Instead of memorizing query syntax or building complex filter chains, just ask:
- "Show me all payment errors from the last 2 hours"
- "What errors started after the v2.4.1 deployment?"
- "Why are response times increasing on the /api/checkout endpoint?"
Lognitor's AI processes the question, searches relevant logs, and returns an answer with references to specific log entries. It's not a chatbot wrapper — it's log analysis that understands context.
Predictable Pricing
Lognitor uses flat-rate pricing. Every plan has a fixed monthly log limit. There are no event-volume overages — you'll never get a surprise bill because a production bug generated a flood of errors.
Plans range from a free tier (enough to evaluate with real production data) to enterprise. AI is included in paid plans, and the AI wallet is available on all plans for additional credits.
What Lognitor Doesn't Do (Yet)
Being transparent about scope: Lognitor currently supports 5 SDK platforms (Node.js, Python, PHP, React, Browser). It doesn't offer session replay, distributed tracing, or performance transaction monitoring. These are on the roadmap, but if you need them today, you'll need a different tool for those specific capabilities.
Lognitor is purpose-built for solo developers and teams of 2-25 who want comprehensive observability in one tool without enterprise complexity. If that's you, it's worth trying.
Get Started
Free tier available. No credit card required. Go from zero to full observability in about 2 minutes.