How to Find Dead Stock in Your Shopify Catalog
This guide offers a practical approach to identifying dead stock and slow-moving items in your store. Learn how to rank these products by the cash they tie up, and differentiate between items that are unwanted and those that are simply hard to find.
Every ecommerce admin is good at telling you what sold. Almost none of them are good at telling you what didn't.
That asymmetry is the whole problem. A sale is an event: it creates an order, a line item, a row in a report. A non-sale is the absence of an event, and absences don't generate rows. So the products quietly sitting on your cash never show up in a dashboard. You find them when you trip over them during a stock count, or when someone asks why working capital keeps climbing while revenue doesn't.
What follows is a method for finding them on purpose. It's arithmetic, not magic — you can work through it with a CSV export and an afternoon. The method matters more than any tool that automates it, so it's worth understanding on its own terms.
Define the terms before you measure anything
Most inventory audits go wrong in the first ten minutes, because "dead stock" gets used to mean three different things.
Dead stock is inventory with no sales in a window you consider meaningful. The key word is yours — 90 days of silence means something very different for a basic tee than for a winter coat.
Slow movers still sell. They just sell slower than they consume capital and shelf space. These are more dangerous than true dead stock, because the occasional order makes them feel alive, and you keep reordering them out of habit.
Overstock sells at a perfectly healthy rate — you simply bought far too much of it. Same symptom, completely different cure. Discounting a healthy seller because you over-ordered destroys margin on a product that didn't need help.
Three different diseases, three different treatments. Lumping them together is how stores end up discounting the wrong things.
The data you need — and the field everyone skips
For every variant, you need four things:
- units currently on hand
- unit cost (not retail price)
- the date of its last sale
- units sold across a trailing window, ideally with the days it was actually in stock
Three of those come free with any order and inventory export. The fourth is the one that quietly breaks everything: cost per item.
Without unit cost, you can't calculate how much money a product is holding, which means you can't rank anything, which means you're left sorting by "days since last sale" and treating every stale SKU as equally urgent. They are not. If you take one thing from this article, make it this: go fill in the cost field. Everything downstream depends on it.
The method, step by step
1. Days since last sale
The simplest signal, and a reasonable first filter:
days since last sale = today − date of most recent sale for this variantDo it at the variant level, not the product level. A hoodie that sells beautifully in Medium and hasn't moved a single XXL in four months looks perfectly healthy at product level. The dead stock is hiding inside a healthy-looking parent.
2. Velocity — and the stockout trap
Days since last sale tells you something stopped. Velocity tells you how fast it was going:
weekly velocity = units sold in window ÷ weeks in windowHere's the trap that ruins most manual analyses. A variant that was out of stock for six of the last eight weeks didn't fail to sell — it was unable to sell. Divide by the full window and you'll brand your best sellers as slow movers, stop reordering them, and turn a supply problem into a demand problem.
So divide by the time it was actually purchasable:
adjusted velocity = units sold ÷ (in-stock days in window ÷ 7)This one correction changes which products end up on your list. It's also the single most annoying thing to reconstruct by hand, because it needs inventory history, not just current stock.
3. Rank by capital, not by age
Now the step that turns analysis into action:
capital at risk = units on hand × unit costConsider two variants that look equally guilty by age:
- A — last sold 128 days ago, 84 units on hand at $28 cost → $2,352 frozen
- B — last sold 96 days ago, 12 units on hand at $9 cost → $108 frozen
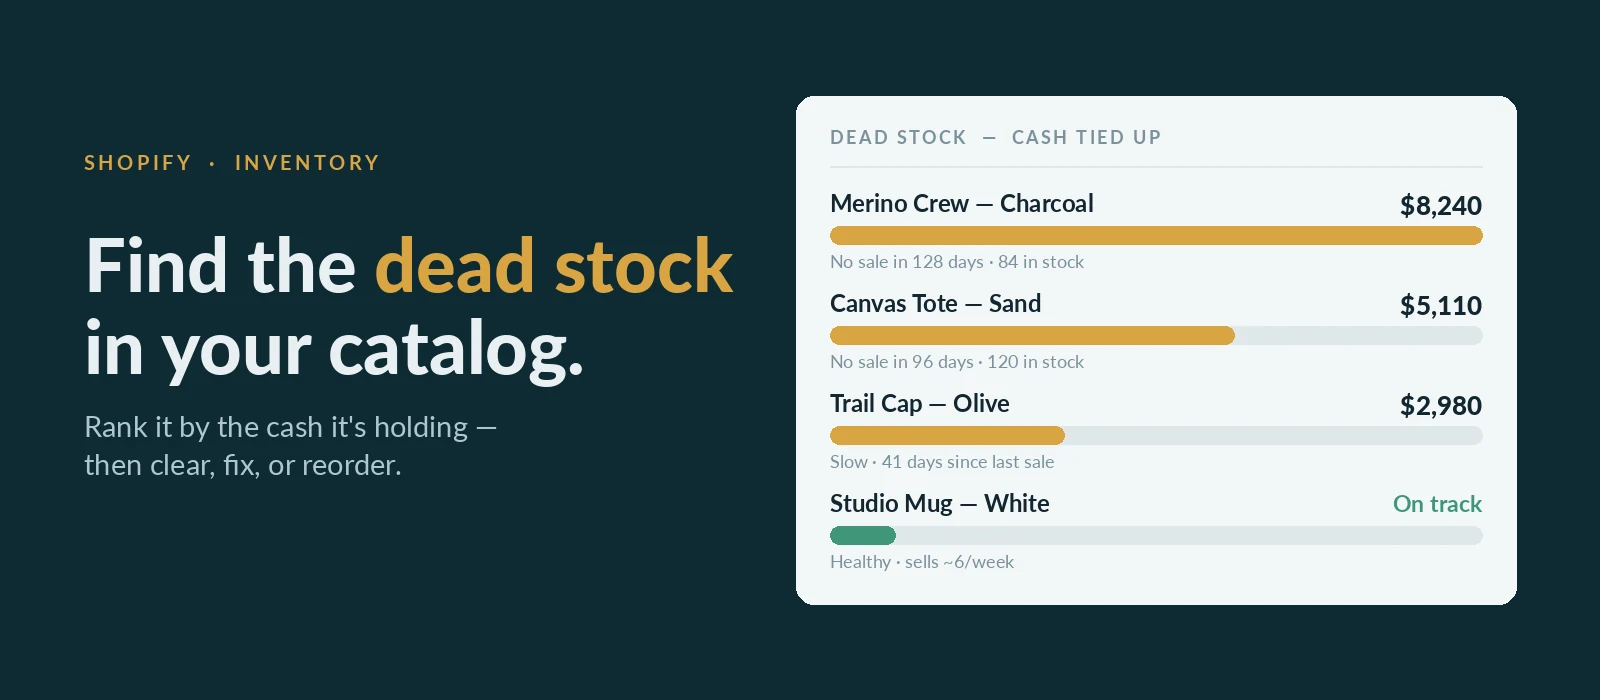
Sorted by days since last sale, A and B sit next to each other and feel like the same size of problem. They're twenty-two times apart. If you only have one afternoon, it belongs entirely to A.
This is why "number of dead SKUs" is a vanity metric. A hundred dead SKUs holding $400 is a tidying job. Four dead SKUs holding $40,000 is a cash-flow event.
4. Set thresholds that fit your catalog
Ninety days is a convention, not a law. Seasonal ranges, made-to-order lines, and long-tail catalogs all need their own definition of "too quiet." If your thresholds don't reflect how your categories actually behave, your list will be full of false positives and you'll stop trusting it by the second week — which is the real failure mode. An audit nobody trusts is an audit nobody repeats.
Before you discount it: is it dead, or just invisible?
This is the step most audits skip entirely, and it's arguably the one that matters most.
A product with no image doesn't convert. A product with no description doesn't rank. A product with no tags never lands in a collection, never surfaces in filtered navigation, never appears in the places customers actually browse. A product with a missing or duplicate SKU corrupts your reporting so thoroughly that you can't even tell what it did.
None of those products are suffering from lack of demand. They're suffering from lack of exposure — and they'll look identical to genuine dead stock in every report you run.
Discounting a product that customers never had a fair chance to see is how you lose margin on inventory that would have sold at full price. So before anything goes into a clearance pile, run it past a checklist:
- Does it have images? Enough of them, at usable quality?
- Does it have a real description, or a placeholder someone meant to come back to?
- Price, SKU, barcode, weight, and cost — all present?
- Is it tagged, categorised, and actually in a collection?
- Are required metafields filled in?
- Any duplicate SKUs colliding with it?
Anything failing several of those isn't dead. It's untested. Fix it, give it a fair run, and re-measure. If it still doesn't move with a proper listing, now you know something true about demand, and you can discount it with confidence.
A useful way to think about it: a catalog-quality score is a confidence score for your dead-stock analysis. The lower your data quality, the less any of your inventory reporting means.
The same numbers tell you what to reorder
Everything above is also a purchasing system, which is the part people miss. Once you have adjusted velocity, the forward-looking questions fall out of the same arithmetic:
weeks of cover  = units on hand ÷ weekly velocity
reorder point   = (weekly velocity × lead time in weeks) + safety stock
order-by date   = today + (weeks of cover − lead time in weeks)
Lead time is what makes this urgent rather than academic. If a vendor takes six weeks and you have five weeks of cover, you are already late — the stockout is booked, you just haven't felt it yet. Order-by dates catch that before it happens.
And note the symmetry: over-buying is just dead stock that hasn't happened yet. The same velocity number that stops you running out also stops you buying twelve months of a product that sells four times a month. Weeks-of-cover is worth watching in both directions.
Make it a routine, not a project
A one-off inventory audit feels productive and decays almost immediately. New products launch, seasons turn, a supplier slips, something goes quietly dead in week three. The spreadsheet you built in January describes a store that no longer exists.
The version that works is small and regular. Once a week, look at four things:
- What went dead since last week, and how much cash is in it
- What dropped sharply in velocity — the early warning before something goes dead
- What's about to stock out inside its lead time
- Whether your catalog-quality score is moving up or down
Ten minutes a week beats a heroic quarterly audit, because the ten-minute version catches problems while they're still small enough to fix cheaply.
Where the spreadsheet gives up
None of the math here is difficult. What's difficult is the plumbing.
To do this properly you need to join products, variants, inventory levels, inventory history, and order line items; compute per-variant velocity adjusted for in-stock days; multiply by cost; rank by capital; cross-reference every result against a data-quality checklist; and then re-run the whole thing next week, and the week after. At a few hundred variants that's a tedious afternoon. At a few thousand it's a part-time job, and the manual version starts drifting out of date faster than you can rebuild it.
That gap is what inventory-health tooling exists to close. SkuVitals is one option built around exactly this method: it scores the whole catalog for dead stock and slow movers ranked by the capital they're holding, grades every product across a set of data-quality checks, and turns sales velocity into reorder points with order-by dates — re-running nightly rather than whenever someone finds a free afternoon.
Worth keeping in proportion, though: the method above is the actual point. Worked through with an export and a free afternoon, it surfaces the same cash. Software changes how often you can afford to look, not whether the approach works.
The reframe
The useful shift is to stop thinking of dead stock as a merchandising failure and start treating it as a measurement failure.
The cash was always there. The products were always sitting still. What was missing was a report for things that didn't happen — and the discipline to look at it before the money had already been spent.
Go fill in your cost field. Start there.